Validation
foamStar is used to validate Grid2Grid. foamStar is developed by Bureau Veritas and shared with Ecole Centrale de Nantes and it can simulate nonlinear waves, seakeeping problem and also hydro-elasticity problem. It solves multiphase problem with Reynolds Averaged Navier-Stokes equations (RANS) with Volume of fraction (VOF). It is based on standard multiphase solver in OpenFOAM (interDymFoam). To generate waves, foamStar uses explicit blending scheme which blends computed flow values to target values with weight function. The blending function is given as equation Eq.2. Some details of foamStar are explained in Seng [2012] and Monroy et al. [2017].
where
By using Grid2Grid, the target values at blending zone can be replaced by the wave components computed from HOS wave theory. For the validation, considered HOS simulation condition is given in Table 1.
Wave Type |
Value |
HOS-Ocean |
HOS-NWT |
||
2D |
3D |
2D |
3D |
||
Regular Wave |
\(T\) [s] |
0.702 |
0.702 |
||
\(H\) [m] |
0.0431 |
0.0288 |
|||
Irregular Waves |
\(T_p\) [s] |
0.702 |
1.0 |
1.0 |
0.702 |
\(H_s\) [m] |
0.0288 |
0.10 |
0.05 |
0.0384 |
|
\(\gamma\) [-] |
3.3 |
3.3 |
3.3 |
3.3 |
|
Extreme Waves |
\(T_p\) [s] |
17.5 |
|||
\(H_s\) [m] |
15.5 |
||||
\(\gamma\) [-] |
3.3 |
||||
Simulation results
The wave elevation computed by using foamStar and HOS-Ocean are compared in Fig. 6.
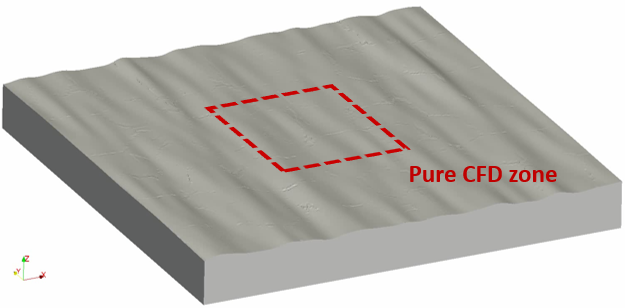
Small differences are observed but it is assumed to be caused by the resolution of the finite volume mesh which is not sufficient near the free surface. The VOF solver gives then those differences. Snapshots of HOS-Ocean wave fields are shown in Fig. 6.
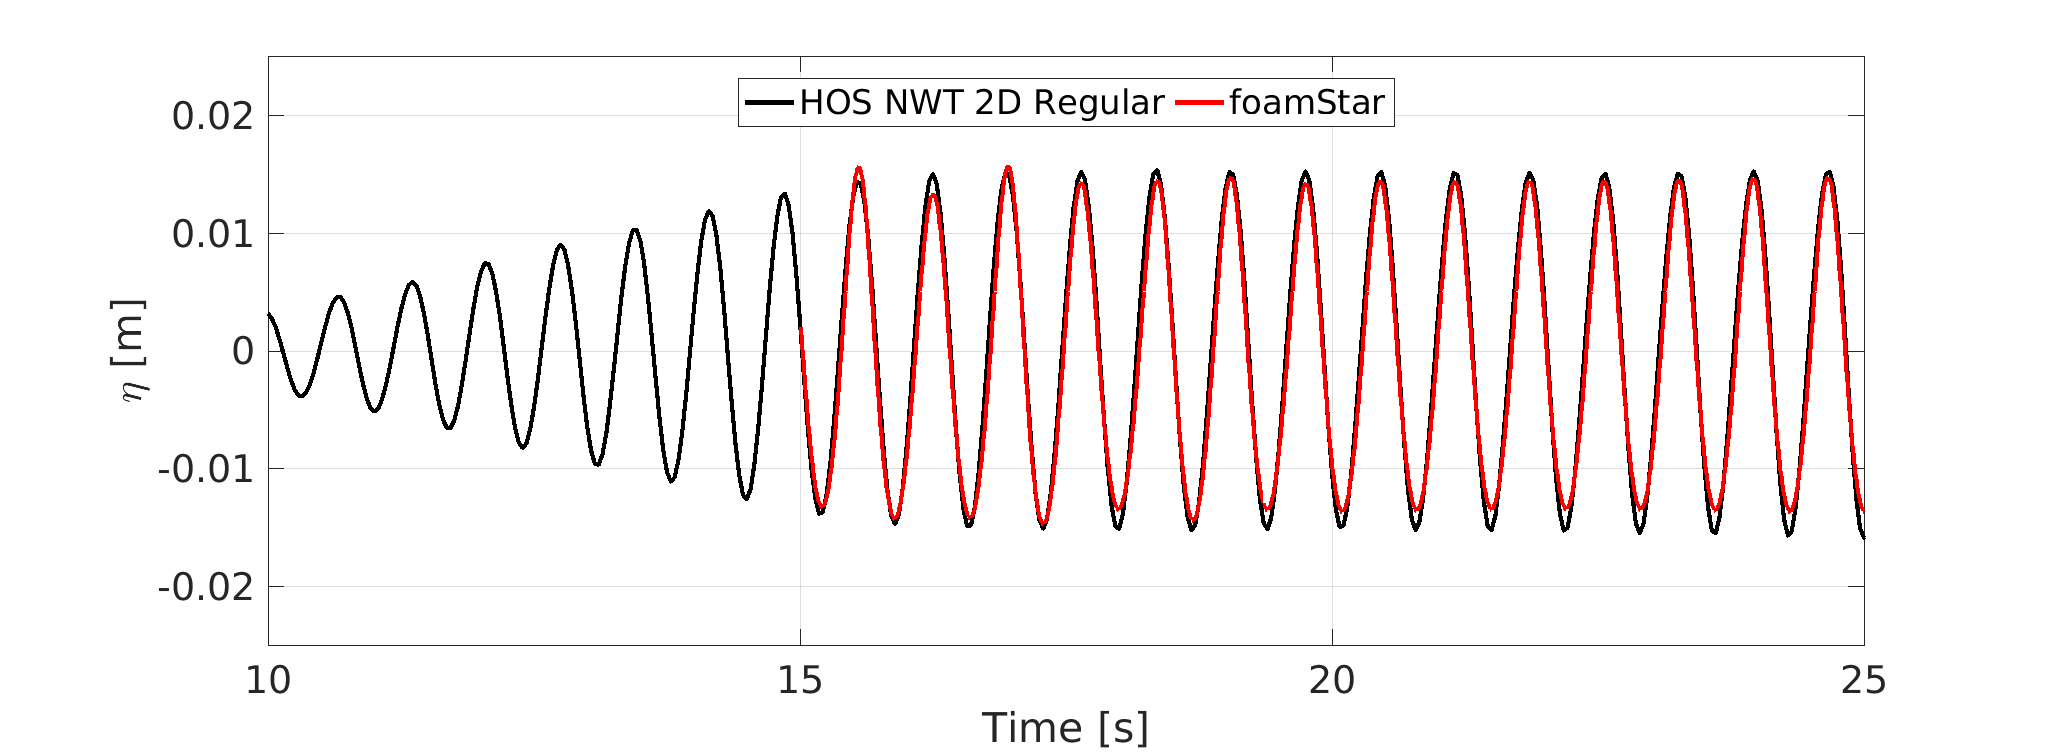
The results of HOS-NWT for a two dimensional case is shown in Fig. 8. And a simulation snapshot is shown in Fig. 9. Three dimensional waves with HOS-NWT are also given in Fig. 10 and Fig. 11.
 HOS-Ocean 2D Irregular Waves
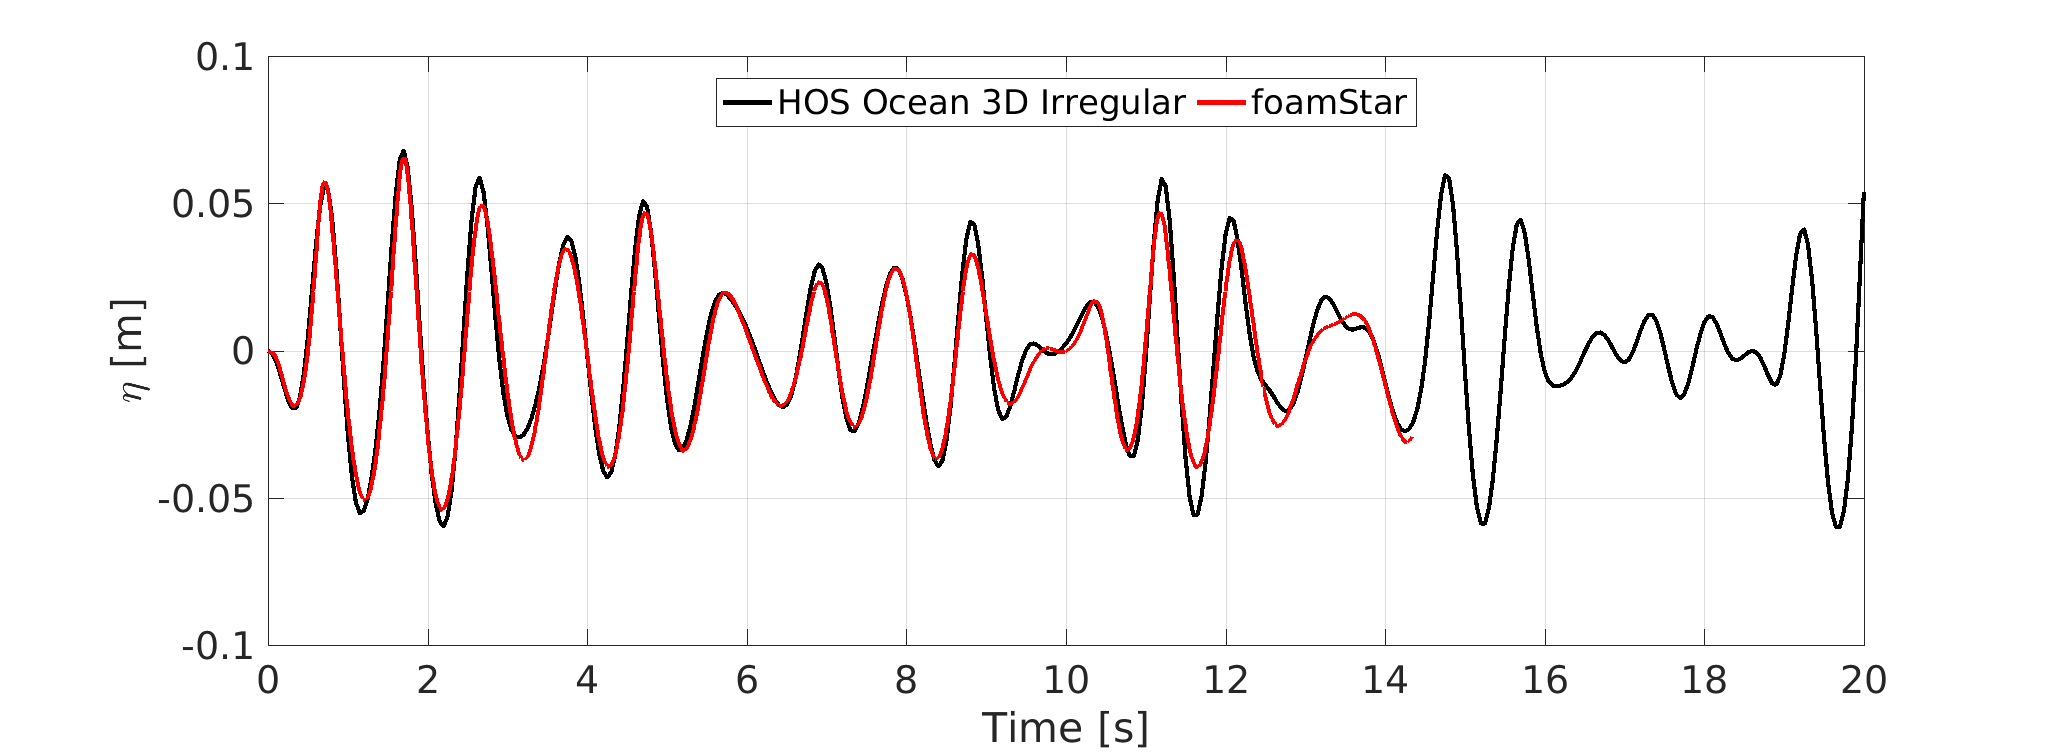 HOS-Ocean 3D Irregular Waves
Fig. 6 Comparison of HOS-Ocean wave elevation
 HOS-Ocean 2D Irregular Waves
 HOS-Ocean 3D Irregular Waves
Fig. 7 Snapshot of HOS-Ocean wave fields by foamStar
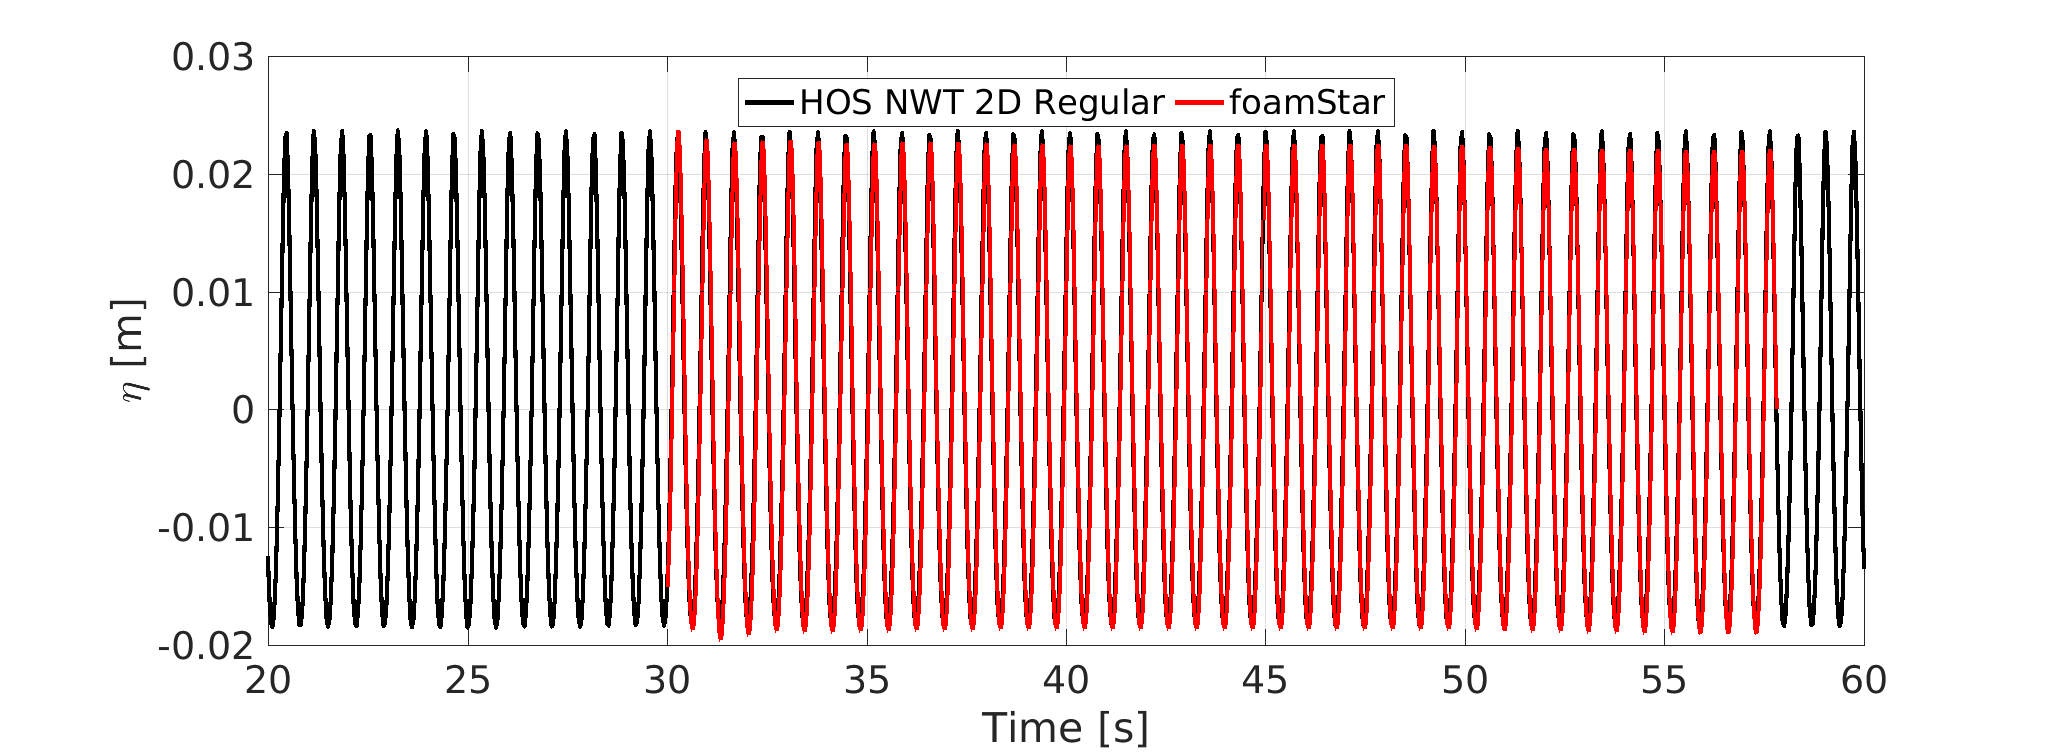 HOS-NWT 2D Regular Waves
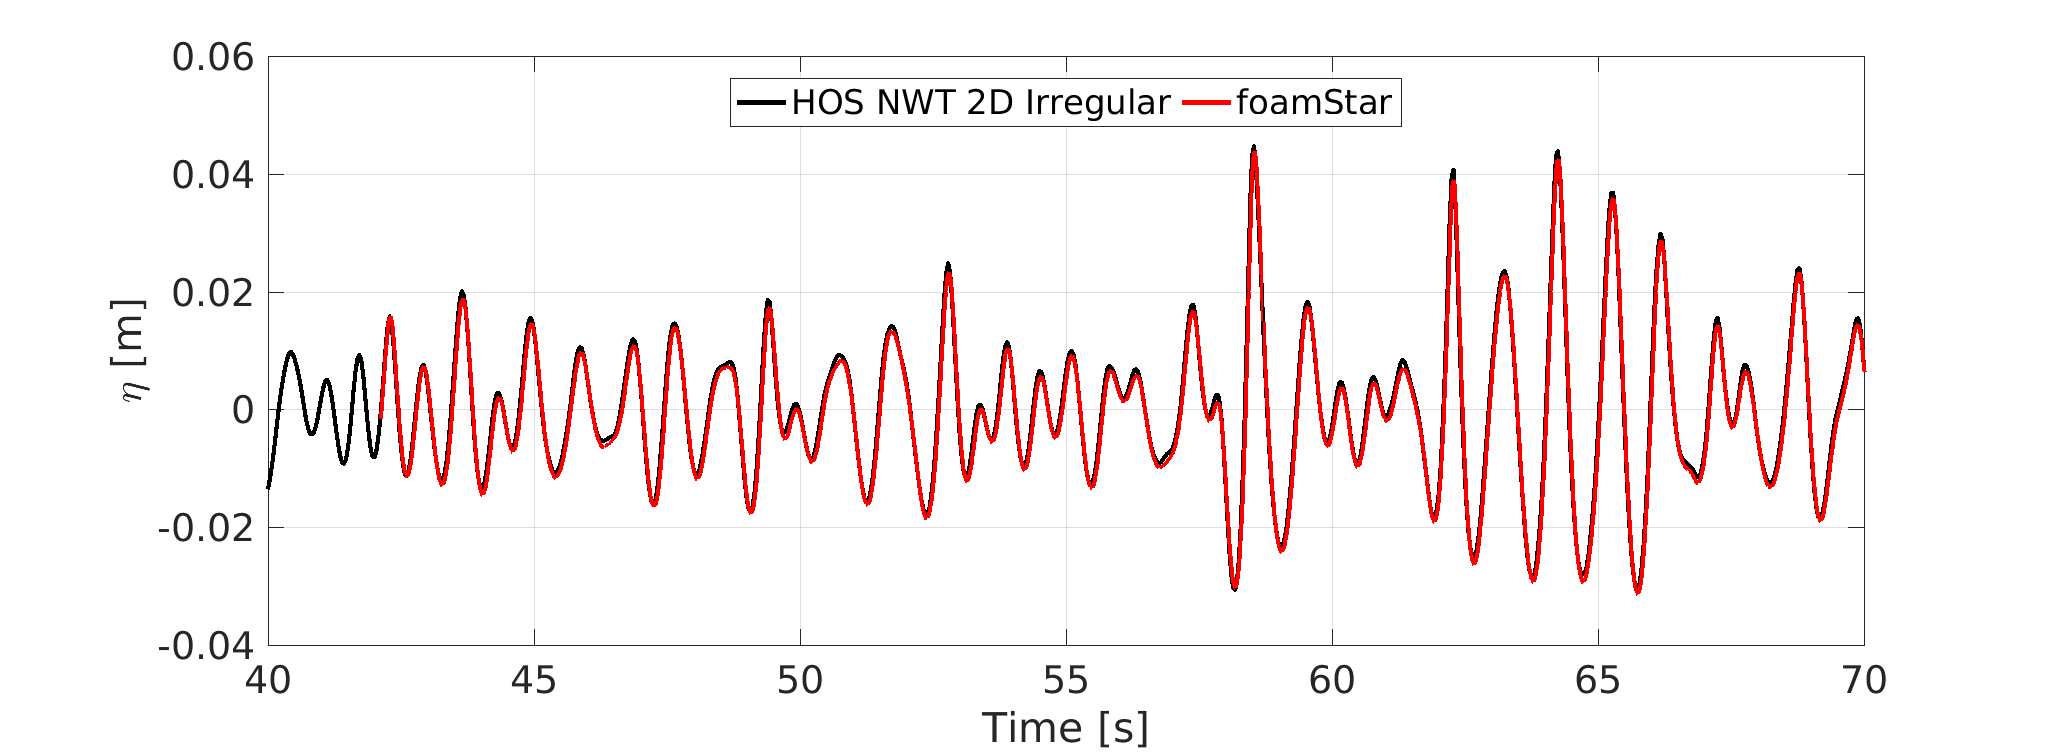 HOS-NWT 2D Irregular Waves
Fig. 8 Comparison of HOS-NWT 2D wave elevation
 HOS-NWT 2D Irregular Waves
 HOS-NWT 2D Irregular Waves
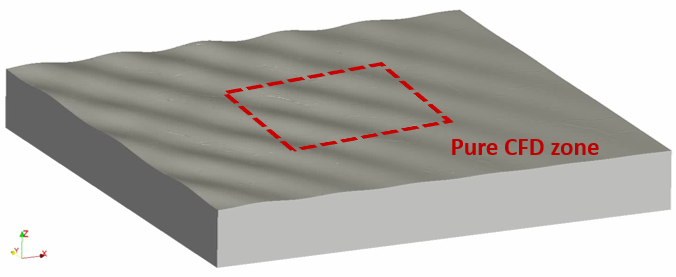
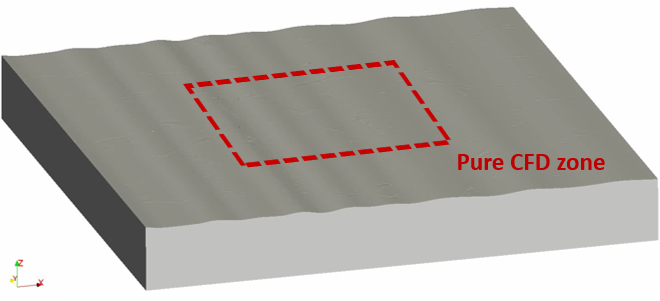
Fig. 9 Snapshot of HOS-NWT 2D wave fields by foamStar
 HOS-NWT 3D Regular Waves
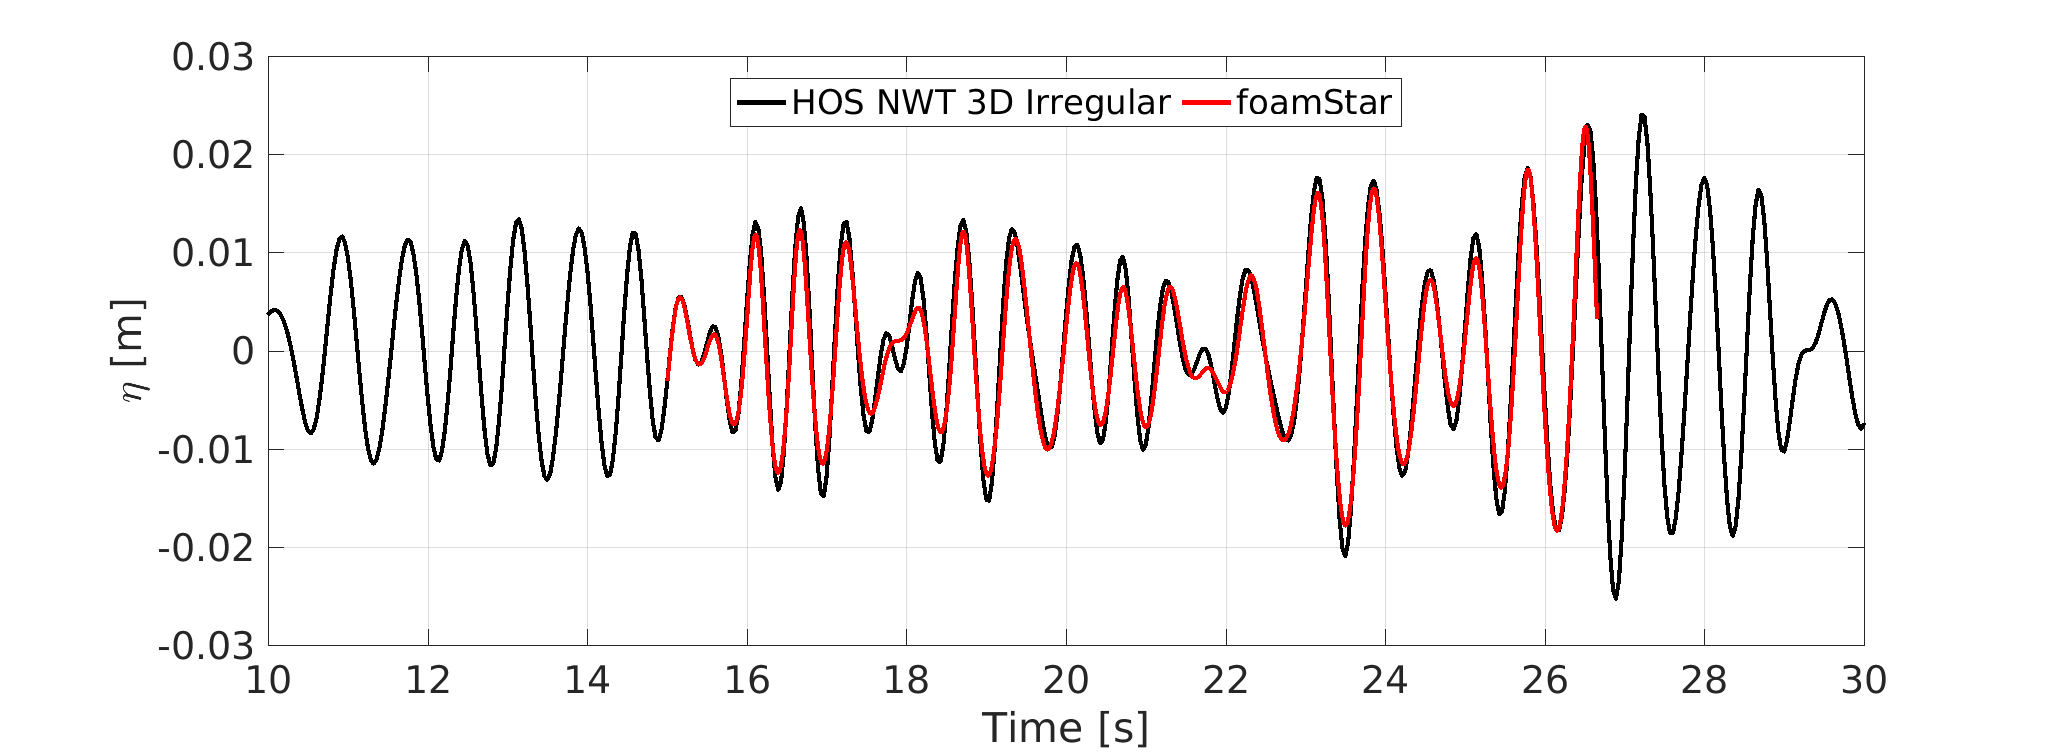 HOS-NWT 3D Irregular Waves
Fig. 10 Comparison of HOS-NWT 3D wave elevation
 HOS-NWT 3D Regular Waves
 HOS-NWT 3D Irregular Waves
Fig. 11 Snapshot of HOS-NWT 3D wave fields by foamStar
Simulation of extreme waves (1000 year return period waves in Gulf of Mexico(GOM) for conditions: \(H_s=17.5 m, T_p=15.5 s, \gamma=3.3\)) is simulated with HOS-NWT for 2D cases and used to generate waves in foamStar. The waves are compared with experiments performed in the wave basin of Ecole Centrale de Nantes (ECN). To simulate nonlinear breaking waves, the wave breaking model in HOS is utilized and allows also to capture when wave breaking occur. The expected wave breaking events are shown in Fig. 12. In the experiments, wave breaking is observed at the expected position and time by HOS wave theory. The breaking moment in the experiment is shown in Fig. 13. The time series of wave elevation measured in the experiments are compared with the results of simulation using Grid2Grid in Fig. 14. The simulation snapshot when wave breaking occur is shown in Fig. 15. The small disturbance at the wave front is observed.
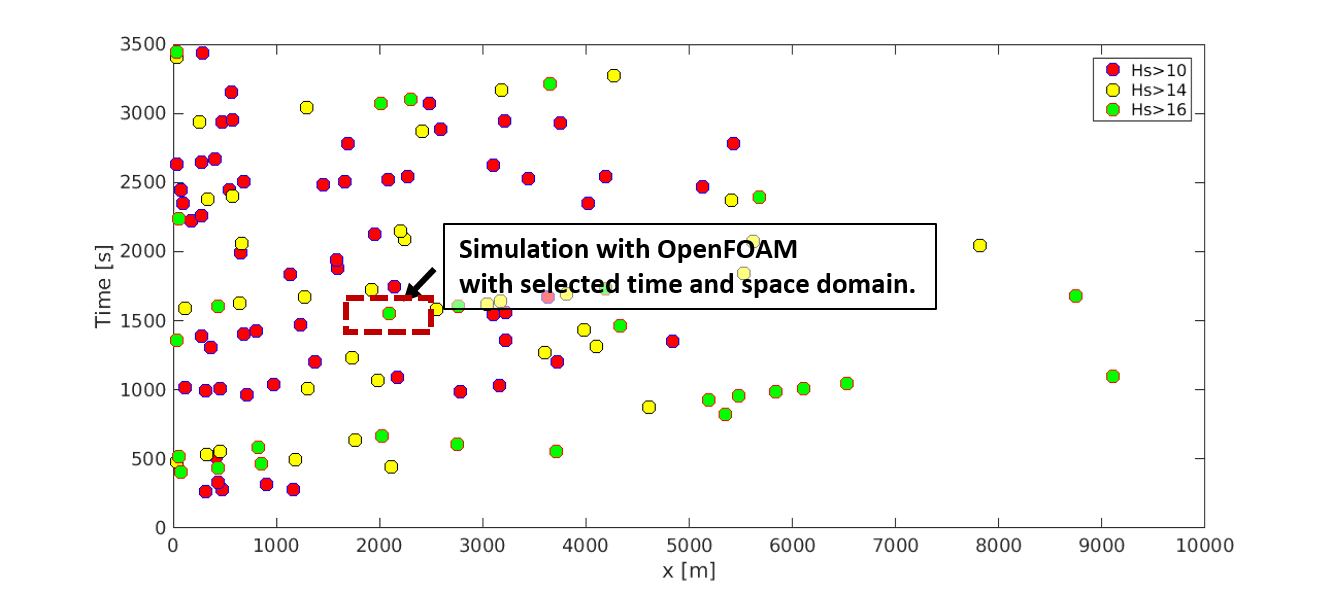
Fig. 12 Expected wave breaking by HOS
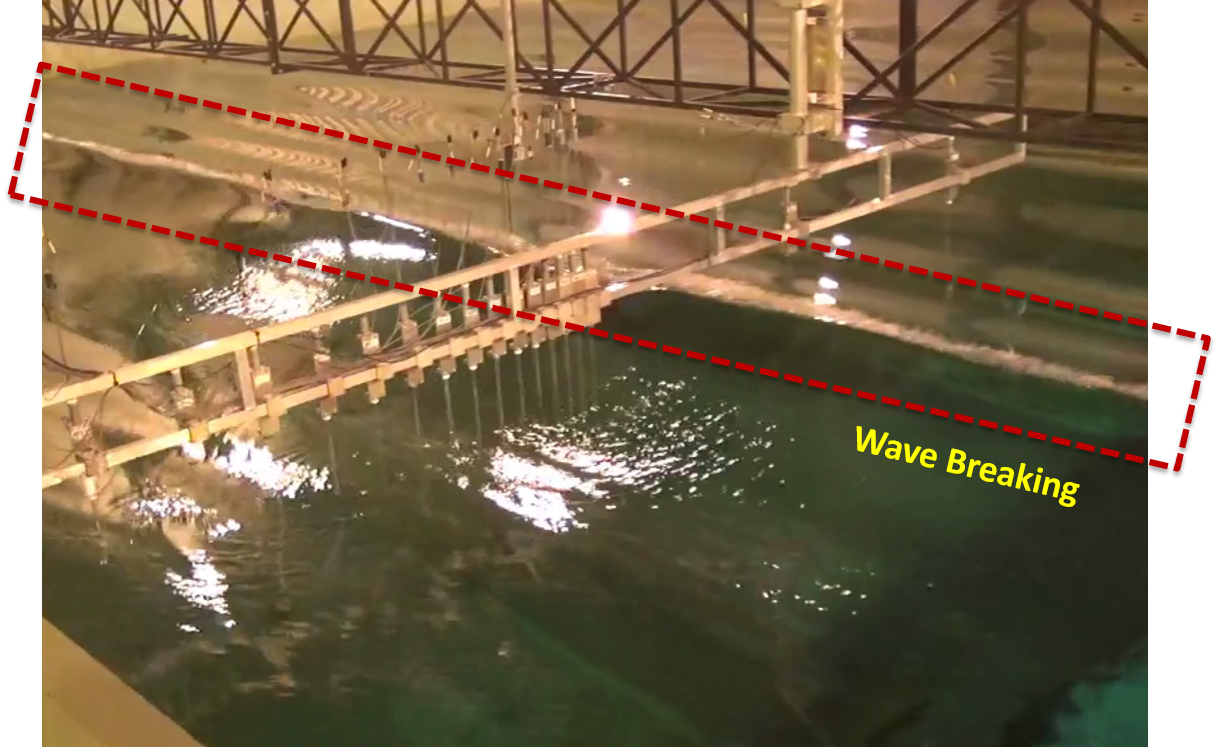
Fig. 13 Observed wave breaking in experiment
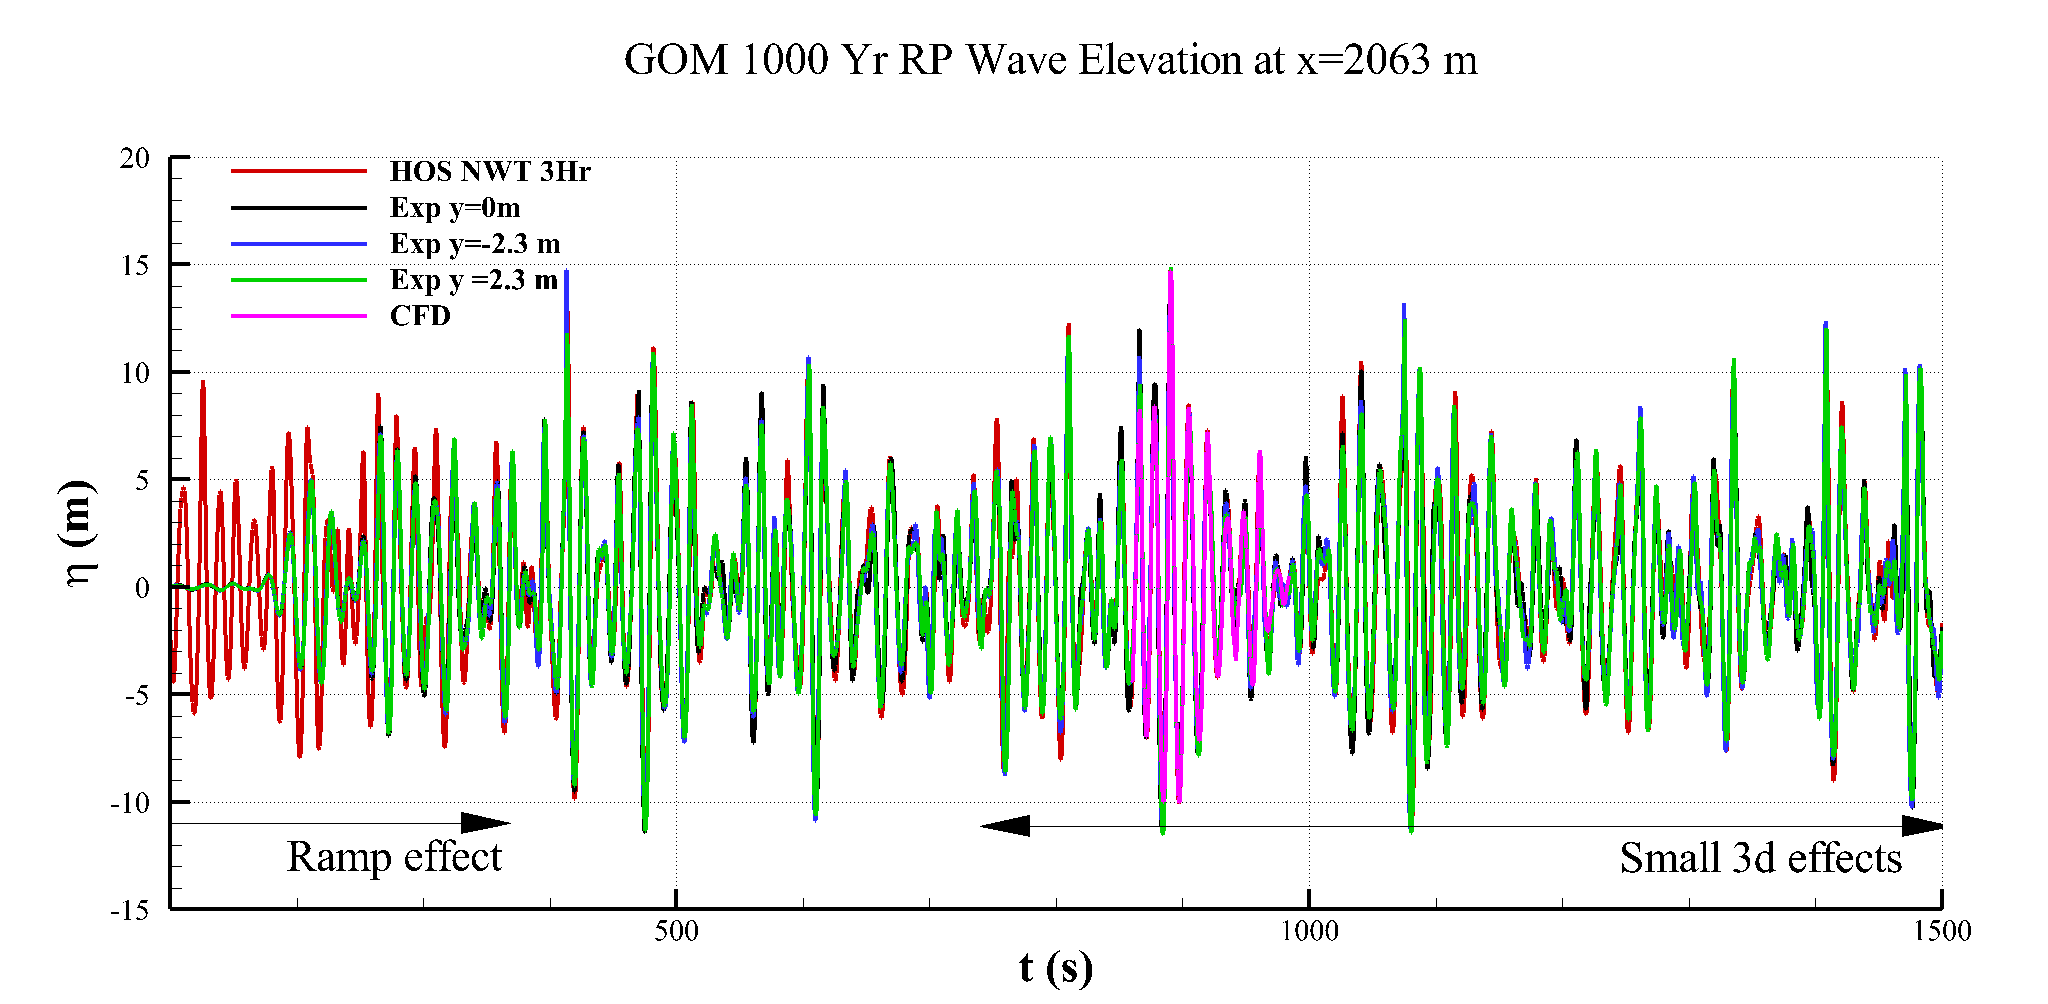 Overall wave time series
 Wave elevation at the wave breaking moment
Fig. 14 Snapshot of HOS-NWT 3D wave fields by foamStar
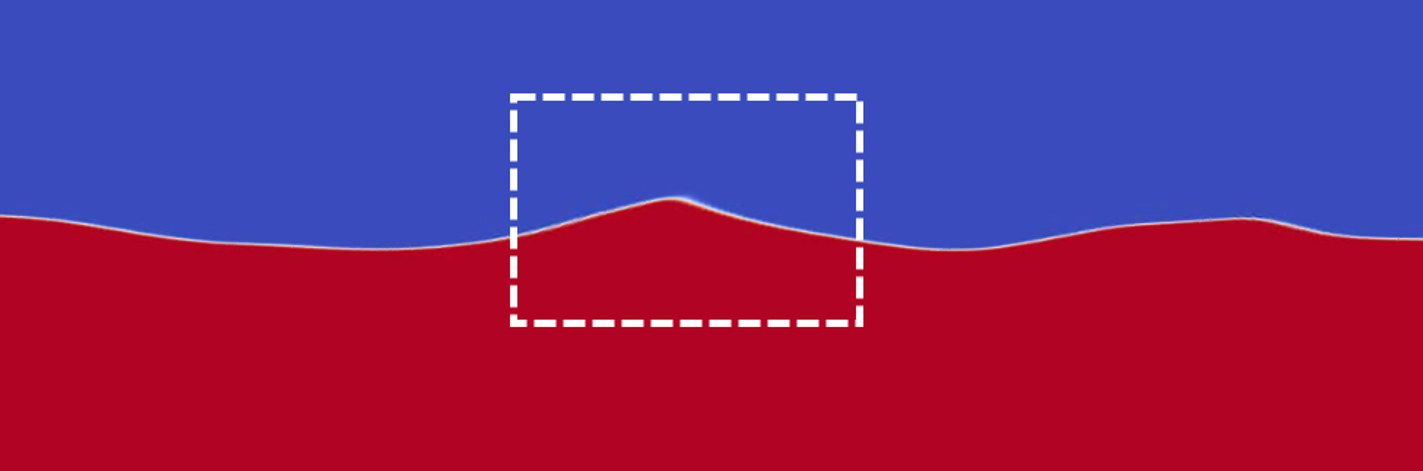
Fig. 15 Simulation of wave breaking by foamStar and Grid2Grid